
Pivot Table Excel Tutorial: Excel learning resource
Pivot Table Excel Tutorial
A beginner-paced pivot table build from a blank sheet.
What this video actually covers
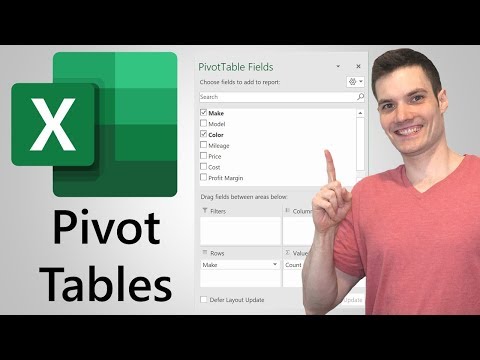
A beginner-paced pivot table build from a blank sheet. Stratvert inserts a PivotTable from a plain data range (including the "Recommended PivotTables" option), then spends most of the video inside the field list — dragging fields into Rows, Columns, and Values, adding a calculated field, sorting the result, and changing the value field settings between sum, count, and average. The "Show Values As" section is the most useful single idea in the video: turning a raw total into a percentage of the grand total with one dropdown change instead of a formula. He finishes by building a matching PivotChart from the same table and toggling "Defer Layout Update," which stops Excel from recalculating after every single field change while you're still building the report.
Where to jump in
What to practice while watching
- Insert a PivotTable from the practice sales dataset and place Region in Rows and Amount in Values.
- Change the Value Field Settings from Sum to Average, then to Count, and note how the numbers change.
- Use Show Values As > % of Grand Total on the Amount field instead of writing a formula for it.
- Turn on Defer Layout Update before rearranging several fields at once, then click Update to apply them all together.
Exercise file
Practice the steps above on a real workbook instead of a blank sheet — no sign-up required.
Download PivotTable practice: sales transactions (.xlsx)Recommended learning path
Start by watching the lesson once without pausing, then reopen Excel and rebuild the example with your own small dataset. Save one clean practice workbook before moving to the next topic.
Source details
- Channel: Kevin Stratvert
- Format: video
- Level: Beginner
- Topic: Pivot Tables
Go deeper with this skill
Use PivotTables to explore data quickly while keeping the source table clean and refreshable. For this article, the goal is to practice: A beginner-paced pivot table build from a blank sheet.
Practice workbook setup
Prepare a source table with headers, dates, categories, and numeric measures.
Practice workflow
- Convert the source data into an Excel Table before inserting the PivotTable.
- Build one simple summary first, then add filters, slicers, or grouping.
- Change value field settings and number formats so the result matches the question.
- Refresh after changing the source data and confirm new rows appear.
Quality checks
- The source table has no blank header names or merged cells.
- The PivotTable answers a specific question.
- Filters and slicers are visible enough for readers to know what they are seeing.
Common mistakes
- Building pivots from messy ranges instead of clean tables.
- Forgetting to refresh after source changes.
- Counting text fields when a numeric sum was expected.
Next actions
- Add one slicer and one PivotChart to turn the summary into a small report.
- Create a second PivotTable from the same source to answer a different question.
Formula focus: even if this workflow is not formula-heavy, add one check cell that confirms the final output still matches the source data.


