

Anyone can paste twelve historical revenue lines into Excel, multiply by 1.15, and call it a three-year financial projection. Real operators, CFOs, and investors look straight through top-down guesses in ten seconds. When revenue slips or churn spikes, a flat 15% guess tells you nothing about why cash tightened or which lever — pricing, customer acquisition pace, working capital terms, or debt service — needs adjusting.
Building on foundational concepts in Excel for Finance & Accounting, this volume walks step by step through designing, linking, stress-testing, and auditing a complete multi-year Driver-Based Financial Model (CloudPulse Analytics, a growing B2B subscription company). Across twelve structured chapters, backed by real Excel schedules, debt waterfalls, DCF calculations, interactive scenario dropdowns, and color-scaled sensitivity matrices, you will master every structural habit professional modelers rely on.
1. Modular Sheet Architecture & Color Standards
Goal: Organize inputs, calculations, outputs, and sanity checks into clean predictable tabs that any reviewer can audit in five minutes.
Messy financial models mix hard-coded tax rates (0.21) inside formulas on sheet 4, paste historical overrides inline over projected years, and hide assumptions on random corners of the workbook. Enforce strict physical separation across five clear layers:
| Layer / Tab | Content Role | Reviewer Rule |
|---|---|---|
Assumptions / Scenarios |
All prices, rates, headcount drivers, case switcher | Only place where hardcoded inputs live |
RevDrivers & Schedules |
Account rollforwards, CapEx/D&A, Working Capital, Debt | Corkscrew rollforwards linking Begin + Change = End |
IncomeStmt, BalanceSheet, CashFlow |
Pure summary outputs pulling from schedules | Zero hard-coded numbers inside rows! |
DCF & Sensitivity |
Free Cash Flow discounting & 2-way WACC heatmaps | Strictly formula-driven valuation metrics |
Checks |
Master Balance Sheet (Assets - Liab - Equity = 0) & Cash checks |
Must display 0 / OK at top of every sheet |
Visual Font Color Standards Readers Expect Instantly
Adopt universal institutional font coloring across every cell:
- Dark Blue font: Hardcoded inputs & historical actuals (never edit formulas!).
- Black font: Same-sheet formulas (
=B4+B6,=SUM(...)). - Dark Green font: Cross-sheet links (
=RevDrivers!B8,=Assumptions!$C$4) so reviewers trace off-tab links immediately without clicking Trace Precedents.
2. Bottom-Up Driver Buildups (Corkscrew Account Rollforwards)
Goal: Model recurring revenue from concrete operating levers — Starting Accounts, New Logos, Churned Logos, and Annual Price — using clean corkscrew rollforwards.
Top-down "Revenue grows 35% per year" hides business mechanics completely. Instead, tie revenue to physical customer volume using a classic Beginning → Additions → Reductions → Ending (“corkscrew”) rollforward where every year’s Beginning balance (C3) equals last year’s Ending balance (=B6).

Verifying Exact Cell Links & Precision Discipline
Look closely at row 5 (Churned Accounts): =-ROUND(B3*0.08, 0). Rounding discrete customer counts avoids projecting "19.2 lost accounts", while pricing escalates smoothly (=B7*1.04). Recognized ARR (=B6*B7) multiplies ending active customers cleanly, letting management test either raising price 4% OR cutting churn from 8% to 5.5% cleanly on one driver grid!
3. Clean Income Statements & Sign Conventions
Goal: Assemble a linked multi-year P&L that flows smoothly from Gross Revenue through Gross Profit, EBITDA, and Net Income with unambiguous signs.
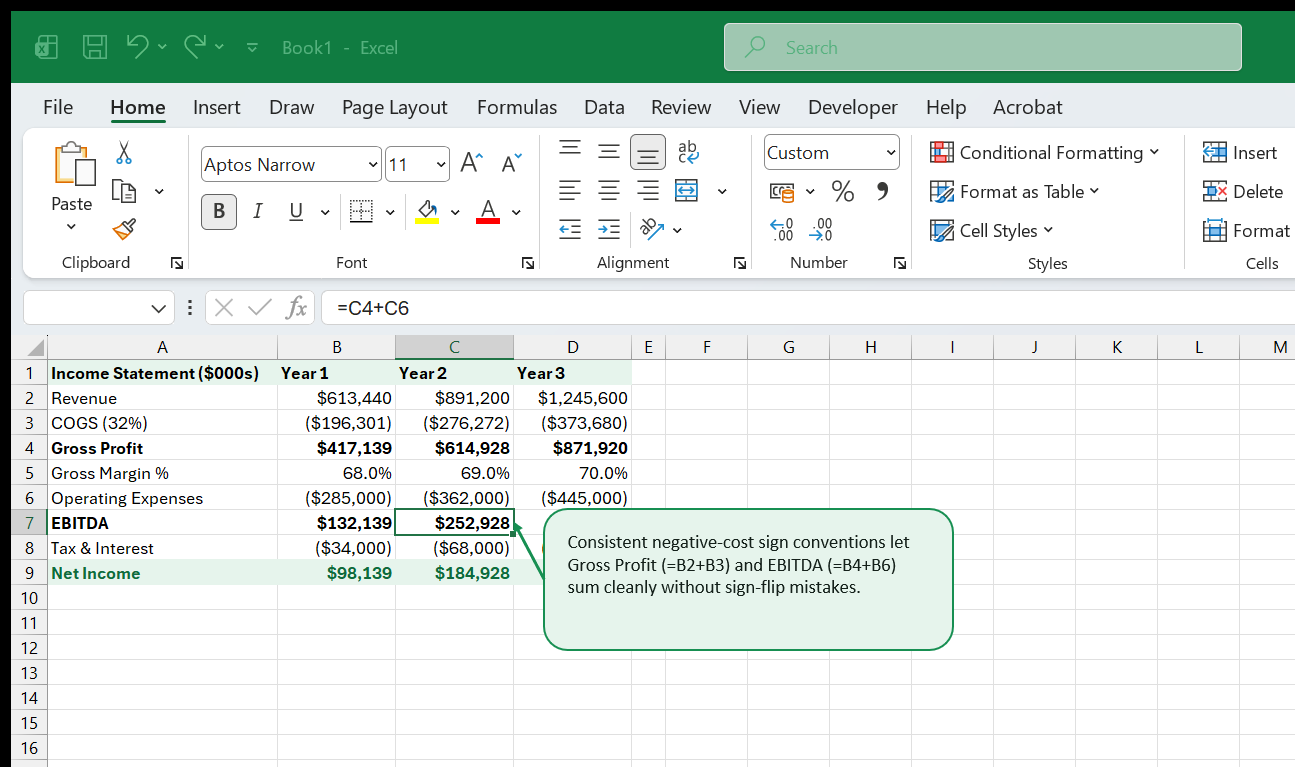
Half of spreadsheet errors in corporate finance happen when someone subtracts a negative cost (-(-285,000)) and accidentally adds expenses onto Gross Profit! Pick one sign rule at project start and guard it ruthlessly:
Custom Formats for Clean Institutional P&Ls
Format currency rows with $#,##0;($#,##0);"-" so negative COGS (($196,301)) displays in clean accounting parentheses while 0 renders as a quiet dash (-), stripping visual noise across multi-year blocks! Link every cost margin driver (32%, 31%, 30%) strictly back to Scenarios/Assumptions rather than typing 0.31 inside the Income Statement itself.
4. Working Capital & Term Debt Schedules (PMT & Amortization)
Goal: Model cash timing effects from Accounts Receivable/Payable and build a linked Debt Amortization schedule connecting Balance Sheet debt to Income Statement interest.
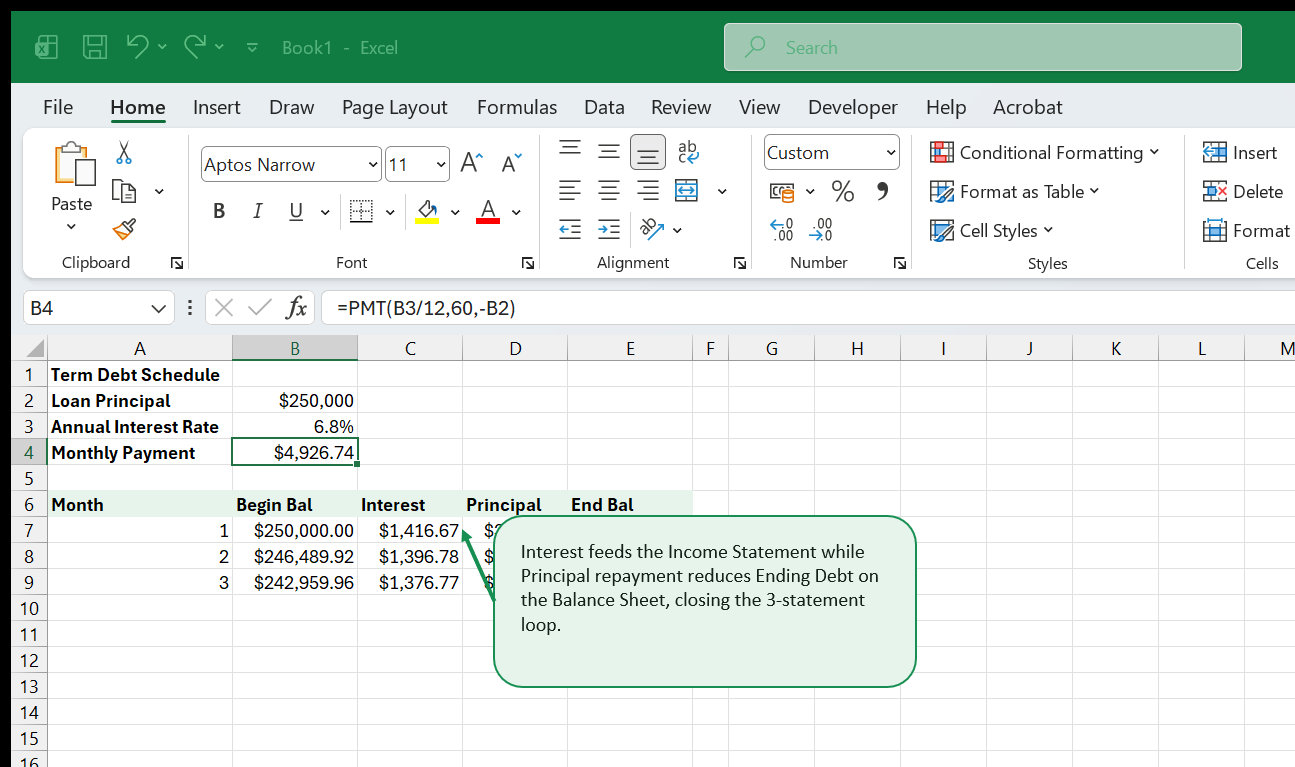
Profit on an Income Statement rarely equals cash inside the bank account. Growing businesses tie cash up inside Accounts Receivable (AR) before customers pay invoices and benefit briefly from Accounts Payable (AP) timing. Alongside working capital, term loans split every fixed cash payment dynamically into tax-deductible Interest (IncomeStmt) and Balance-Sheet Principal Paydown (DebtSchedule).
=PMT(B3/12, 60, -B2)Working Capital Formula Quick Reference
- Accounts Receivable (Asset):
=Revenue * (DSO_Days / 365)(increase in AR is a cash outflow). - Accounts Payable (Liability):
=ABS(COGS) * (DPO_Days / 365)(increase in AP is a cash inflow). - Net Working Capital Change:
=(Prior_AR - Current_AR) + (Current_AP - Prior_AP).
5. Linking the 3-Statement Loop & Balance Sheet Check Row
Goal: Wire Income Statement Net Income, D&A, Working Capital, CapEx, and Debt Principal into Cash Flow so the Balance Sheet always balances (Assets = Liabilities + Equity).
A genuine 3-statement model locks all three reports together in one tight accounting circle:
- Cash Flow Statement begins with Net Income (from
IncomeStmt), adds back non-cash Depreciation & Amortization, adjusts for Change in Net Working Capital, subtracts CapEx (Investing), and adds/subtracts Net Debt Borrowing / Repayment (Financing) to compute Ending Cash. - Balance Sheet Cash equals
CashFlow!EndingCash(=CashFlow!D22). - Retained Earnings rolls forward cleanly (
=Prior_Retained + Net_Income - Dividends).
Guarding Against Silent Unbalanced Models
Add a bold top banner on every tab (Row 1 or Row 2) computing =ABS(TotalAssets - (TotalLiabilities + TotalEquity)) < 0.01, wrapped in Conditional Formatting (Red whenever >= 0.01)! Never fix an unbalanced Balance Sheet by inventing a "Plug" line — 99% of imbalances expose a reversed sign on Working Capital or missing CapEx on the Cash Flow Statement.
6. Avoiding Accidental Circularity (Interest Cash Loops)
Goal: Eliminate fragile circular reference loops caused by linking Interest Expense directly to Ending Debt when Cash sweeps interest.
Enabling Iterative Calculation blindly inside Excel Options (File → Options → Formulas) makes models unstable and hides real broken formulas silently. Notice how cleanly our Debt Schedule avoided circularity: calculating Period N Interest on Beginning Debt Balance (=B7*(B3/12)) rather than Ending or Average Debt breaks the circular loop cleanly, runs instantaneously, and never corrupts DCF recalculations!
7. Unlevered Free Cash Flow & DCF Valuation (NPV Gotcha!)
Goal: Compute Unlevered Free Cash Flow (UFCF), Gordon Growth Terminal Value, and Enterprise Value safely without triggering Excel’s #1 NPV() offset trap.
To value CloudPulse independently of capital structure, compute Unlevered Free Cash Flow:
UFCF = EBIT × (1 - TaxRate) + D&A - CapEx - Change in NWC.
Next, project Terminal Value at the end of the explicit forecast horizon (Year 4) using the perpetual Gordon Growth equation (FCF_Final * (1 + g) / (WACC - g)), verify WACC > g always, and discount all cash flows cleanly:
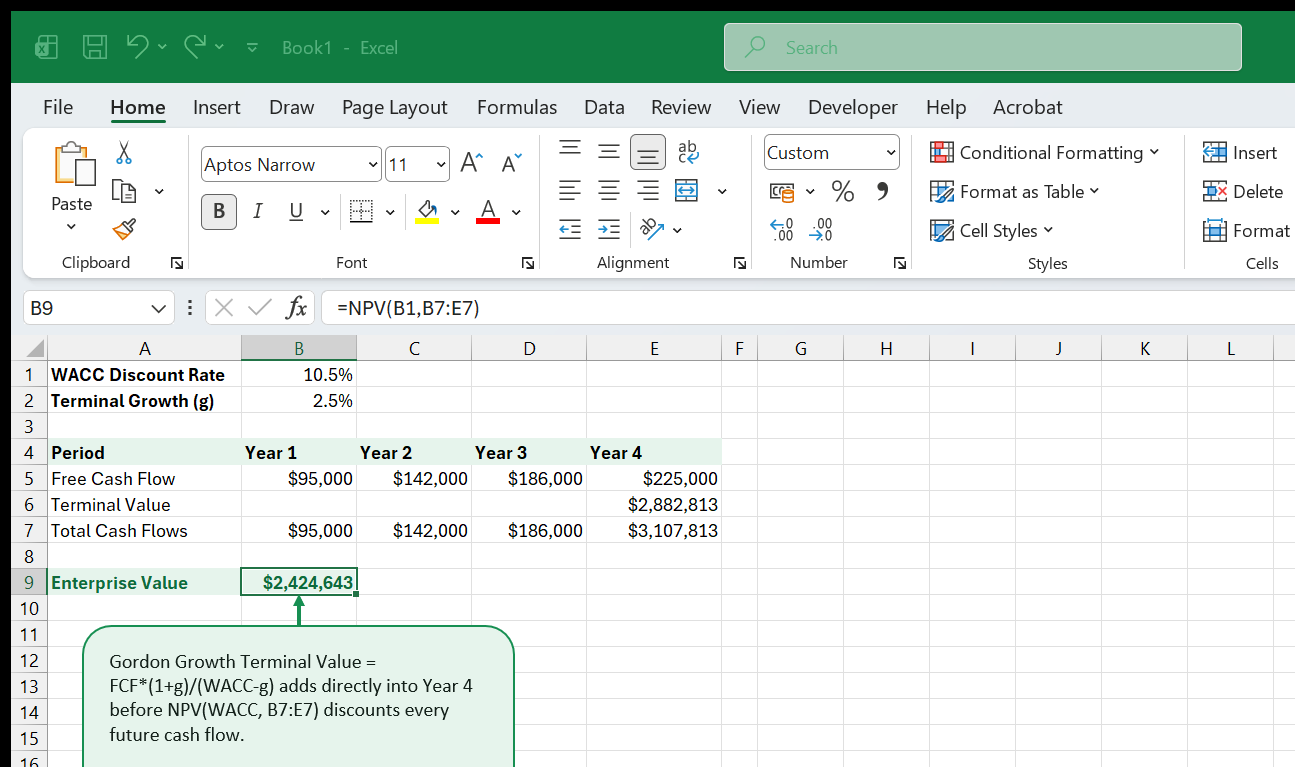
=NPV(B1, B7:E7)Remember Excel’s NPV Year-0 Timing Rule!
Unlike IRR (which requires Year 0 upfront cost inside the array), Excel’s NPV(rate, values) assumes the VERY FIRST cell inside values arrives at the END of Year 1 (t = 1)! Always pass strictly Years 1..N inside NPV(...), and add any upfront Year 0 outlay outside the NPV() parentheses afterward! For uneven cash dates (Mar 15, Nov 3), switch immediately to XNPV(rate, cashflows, dates) cleanly. See Excel for Finance & Accounting and NPV Function Reference.
8. Multi-Case Scenario Modeling (Base / Upside / Downside)
Goal: Wire one clean dropdown selector driving INDEX + MATCH so every assumption, statement, and valuation flips instantly between operating scenarios.
Copying your workbook three times into Model_Base.xlsx, Model_Upside.xlsx, and Model_Downside.xlsx guarantees version chaos the instant someone fixes one bug in Base and forgets Upside. Keep one single model powered by an interactive case selector table!
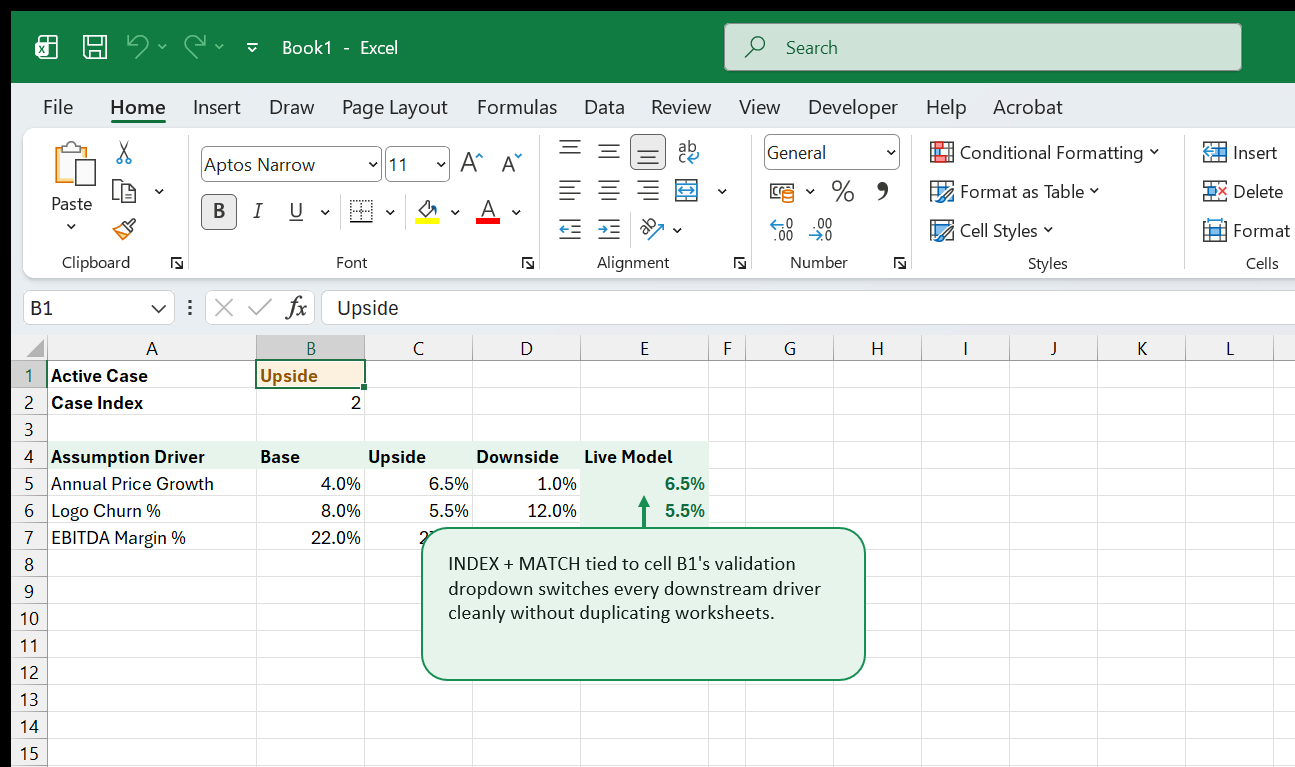
=INDEX(B7:D7, $B$2)Combining cell B2 (=MATCH(B1, B4:D4, 0)) with INDEX(..., $B$2) keeps every downstream driver row short, fast (non-volatile unlike OFFSET/INDIRECT), and completely self-documenting!
9. Two-Way Sensitivity Heatmaps (WACC vs. Terminal Growth g)
Goal: Stress-test valuation assumptions across 16 simultaneous pairs using Excel Data Tables (What-If Analysis) and Color Scale heatmaps.
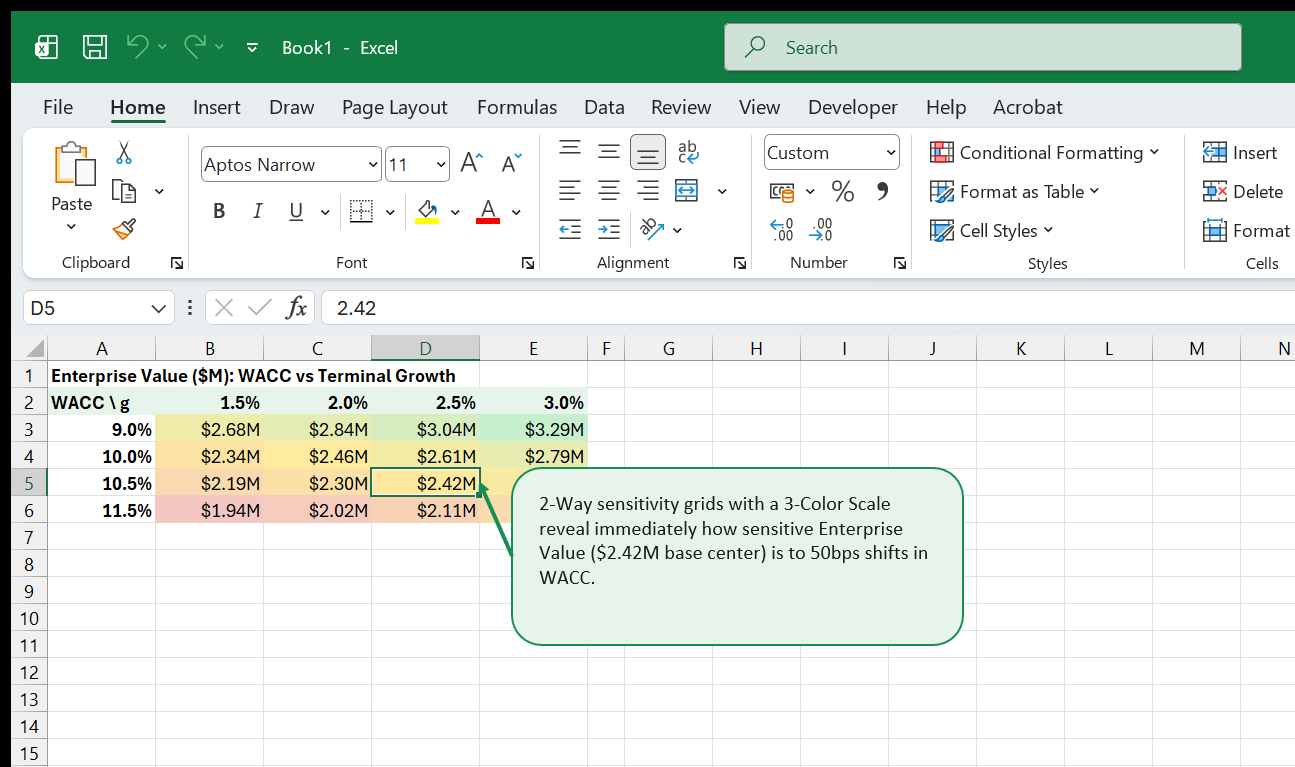
Single-point valuations lie cleanly: saying "CloudPulse is worth $2.42M" obscures how wildly value shifts if cost of capital tightens by 1% or terminal growth slows down. A 2-Way Sensitivity Matrix stress-tests both drivers across a structured grid centered around your active Base assumption (10.5% WACC vs. 2.5% growth = $2.42M):
Building a Live Sensitivity Table Without Freezing Excel
Select the grid (A2:E6 after linking top-left corner A2 cleanly to =DCF!B9), click Data → What-If Analysis → Data Table…, assign Row Input Cell (g) and Column Input Cell (WACC), then set Formulas → Calculation Options → Automatic Except for Data Tables when modeling huge files so F9 refreshes sensitivity matrices strictly on demand without lagging routine typing!
10. Dynamic Charts & Boardroom Variance Visuals
Goal: Present multi-year revenue bridges, EBITDA margin curves, and Upside vs. Downside ranges cleanly without chart clutter.
Executives rarely scan five-year monthly columns row by row during a 15-minute review. Mirror key takeaways beside crisp visuals:
- Pair Revenue bars with a secondary-axis Gross Margin % line (exact dual-axis setup covered in Excel Charts & Data Visualization).
- Keep horizontal bar or column titles conclusion-oriented (“ARR Doubles by Year 3 Even Under Base 8% Churn”), strip redundant gridlines behind data labels, and format Y-axes cleanly in
$0.0Mor$0Kcustom units.
11. Model Auditing Checklist Before Sharing Externally
Goal: Catch broken links, hardcoded overrides, and hidden precision leaks systematically using built-in Formula Auditing shortcuts.
Run these five audit passes before emailing any financial workbook externally:
- Press
Ctrl + ~(grave accent) (Formulas → Show Formulas) and scan columns visually: every projected cell across Years 1–3 should show identical formula structure — any bare number (891200) jumps out immediately as an unlinked override! - Inspect Formulas → Trace Precedents / Trace Dependents on final DCF Value and Net Income to guarantee zero dead/orphaned drivers.
- Verify zero
#REF!,#VALUE!,#NAME?, or#N/Aerrors anywhere (quick audit guide: Formula Auditing & Error Debugging). - Check
Checksbanner (Balance Sheet Diff = 0.00,CashTie = TRUE). - Save clean model templates cleanly using ExcelBack Finance Templates and confirm print setup (
Landscape,Fit to 1 page wide) before PDF export.
12. Advanced Extensions & Continuing on ExcelBack
Goal: Bridge financial statements into Power Query actuals pipelines, dashboards, and investor-ready reporting decks.
Once your model structure runs smoothly, automate monthly Actuals vs. Model loading by connecting accounting CSV exports through Power Query & M Transformations (Volume 2) straight into a live variance tab, visualize executive KPIs with Excel Dashboard Builder, and inspect financial syntax anytime via our Finance Function Library.
13. Three-Statement Balance Sheet Checks & Cash Flow Reconciliation
Goal: Wire Working Capital deltas (AR, Inventory, AP), D&A, CapEx, and Debt proceeds cleanly onto the Cash Flow Statement so the Balance Sheet balances (Variance = $0.00) across every single forecast year!
Most aspiring modelers struggle on one infamous line item: why did Cash fail to tie out by $142 in Year 3? Ninety-nine percent of Balance Sheet imbalances trace directly back to sign inversions on Working Capital deltas or forgetting an account inside Cash Flow:
| Balance Sheet Account | Formula Rule in Operating Cash Flow | Intuitive Cash Logic |
|---|---|---|
| Accounts Receivable (Asset) | = Prior_AR - Current_AR (negative when AR grows) |
Unpaid customer invoices tie up cash until collected |
| Inventory (Asset) | = Prior_Inv - Current_Inv |
Paying cash for extra warehouse goods lowers bank cash |
| Accounts Payable (Liability) | = Current_AP - Prior_AP (positive when AP grows) |
Delaying supplier vendor payment preserves cash on hand |
| CapEx (PP&E Addition) | = -Forecast_CapEx (Investing Cash Flow) |
New equipment spending reduces cash while increasing Net PP&E |
Always anchor Row 1 of your Model Summary cleanly to Balance Check = ROUND(Total_Assets - Total_Liabilities_Equity, 2). Never insert a hidden "Plug" variable to force Balance Checks cleanly to zero—plugs hide real modeling bugs! Instead, subtract Assets minus L+E on a dedicated Diagnostic_Check tab to trace the exact dollar difference (CapEx, Tax, Interest, or WC) straight back to its origin cell.
14. Circular Interest Loops & Safe Revolver Debt Sweeps
Goal: Model corporate revolving credit lines and Average Debt interest expense cleanly—with built-in Circuit Breaker switches so accidental #DIV/0! crashes never trap Iterative Calculation in infinite #NUM! error loops!
When Interest Expense uses Average Debt Balance (0.5 * (Beginning Debt + Ending Debt)), Ending Debt determines Revolver Drawdown, which alters Cash Available, which alters Interest Expense, creating an intentional circular financial loop.
- Enable File -> Options -> Formulas -> Enable iterative calculation (
Max Iterations: 100,Max Change: 0.0001). - Wire an explicit binary
Circuit_Breakertoggle cell (1 = On / Loop,0 = Off / Beginning Debt Only) inside yourInputstab:
=IF(Inputs!$C$4=1, AVERAGE(BegDebt, EndDebt)*Rate, BegDebt*Rate)If a formula typo ever triggers #VALUE! or #DIV/0! inside an iterative loop, flipping the Circuit Breaker cleanly to 0, fixing the root cell, and returning to 1 clears trapped error caches immediately in two clicks!
15. Unit Economics, Cohort Churn & SaaS LTV/CAC Extensions
Goal: Translate B2B subscription drivers (New Logos, Monthly Churn %, ARPA, Gross Margin %, Sales & Marketing Spend) into institutional unit-economics KPIs alongside GAAP financial statements.
SaaS and marketplace valuation committees inspect three metrics right below EBITDA:
- Customer Acquisition Cost (
CAC):Total Prior-Period S&M Spend / Gross New Customers Acquired. - Customer Lifetime Value (
LTV):(ARPA × Gross Margin %) / Monthly Logo Churn %(multiply by12consistently if using Annual Churn!). - CAC Payback Months:
CAC / (Monthly ARPA × Gross Margin %)— healthy capital-efficient B2B operators recover CAC cleanly inside12–18months; anything exceeding24months signals high financing burn when growth scales!
Build these explicitly from your Revenue Driver sheet so lowering Churn from 2.5%/mo to 1.8%/mo updates Cash Burn, Terminal Enterprise Value, and CAC Payback simultaneously!
16. Monte Carlo & Multi-Variable Tornado Sensitivity Tables
Goal: Rank which forecast driver (Revenue CAGR, Gross Margin, WACC, Terminal Multiple) moves Equity Value per Share the most using sorted Tornado sensitivity bands.
While 2-way Data Tables inspect two variables at a time (WACC vs Terminal Multiple), executives ask across all eight assumptions, which assumption creates the widest valuation swing?
Test +/-10% or Downside/Upside range swings per input cleanly:
- Measure Enterprise Value at Downside (
Low Value) vs Upside (High Value) holding the other 7 inputs constant at Base Case. - Compute Spread (
ABS(High - Low)), sort rows largest-spread-at-top, and plot a clean Stacked Bar / Tornado Chart centered around Base Valuation ($42.5M).
Seeing visually that a 200 bps Gross Margin shift moves valuation by +$11.4M whereas CapEx % moves it by only +$1.2M tells management teams exactly which operational lever to prioritize this year!
17. Formatting Standards & Auditability (FAST / IB Conventions)
Goal: Style every modeling cell cleanly so an investment banker or CFO reads font colors blindly at 10 feet away without clicking a single formula bar.
Adopt strict Wall Street Color Standards universally across every schedule:
| Cell Content Type | Font Color | Structural Rule |
|---|---|---|
| Hardcoded Inputs & Assumptions | Blue (#0000FF) |
Live cleanly in designated Assumptions/Drivers zone, never buried inside formulas! |
| Same-Sheet Calculations | Black (#000000) |
Zero hardcoded magic numbers mixed into formula strings (no =B12*0.21; point cleanly to $B$4) |
| Cross-Sheet Links | Green (#008000) |
Signals immediately where values pull from another tab (=PL!F22) |
| Workbook / External File Links | Dark Red (#800000) |
Flag external references visibly so reviewers audit broken-path risks early |
Align time horizons strictly vertically across columns (Column F = FY24, Column G = FY25… identically on every tab!) so reviewers can inspect any formula horizontally via Ctrl + Shift + R consistency checks cleanly.
18. Debt Sizing, Covenants & Credit Ratio Stress Testing
Goal: Add Leverage Ratio (Net Debt / EBITDA) and Interest Coverage (EBITDA / Interest Expense) covenant checks directly below Debt Schedule lines to test Downside survivability.
Strong Downside case testing proves not just equity upside, but whether the company survives a recession without tripping bank covenants:
- Maximum Leverage Covenant:
Net Debt / EBITDA <= 3.5x-> conditionalalertbadge ("BREACH"ifNetDebt/EBITDA > 3.5). - Minimum Interest Coverage:
EBITDA / Cash Interest >= 3.0x-> signals cash debt-service headroom cleanly. - Minimum Cash Liquidity Floor: Confirm ending minimum Cash stays comfortably above
$2.0Moperating buffer across every quarter in Downside before committing CapEx or dividend payouts.
19. Deal-Ready Delivery & Model QA Review Checklist
Goal: Run a systematic 10-point model audit before distributing valuation decks, lender books, or board packets.
| Audit Check | Verification Procedure | Signoff Criterion |
|---|---|---|
| 1. Balance Sheet Ties | Check Assets minus L+E row across all years | Exact 0.00 variance in Base, Upside, AND Downside! |
| 2. Cash Flow Reconciles | Compare Ending Cash CF line vs Cash row on BS | 0.00 discrepancy across every historical + forecast period |
| 3. Hardcode Scan | Press Ctrl + ~ (Show Formulas) & check colors |
All black formulas copy uniformly across years; zero hidden tweaks |
| 4. No Unused Names/Errors | Press Ctrl + F3 Name Manager -> filter errors |
Zero broken #REF! or external dead paths |
| 5. Data Tables Recalculated | Press F9 cleanly under Automatic Except Data Tables |
Tornado & WACC x Multiple matrices show smooth monotonic gradients |
| 6. Print Margins Tested | Inspect Ctrl + P across all presentation tabs |
Clean 1-page-wide landscape PDF export, readable font size (>= 8pt), A1 selected on Save |
Pair clear driver mechanics, three-statement integrity, disciplined Scenario/Data Table hygiene, and relentless audit checks—and your financial models earn immediate trust across every executive table.
20. Hands-On Valuation Lab: Modeling an Acquisition Target
Goal: Walk end-to-end through valuing a mid-market B2B software acquisition (Northstar Cloud Corp.) using driver build, UFCF projection, Debt Schedule sizing, and WACC x Multiple sensitivity bounds.
Practice structuring an executive 5-year model cleanly on four synchronized tabs (Assumptions, Drivers_PL, CF_Debt, Valuation):
- Assumptions & Scenario Selector: Put
Scenario = 2(1=Downside, 2=Base, 3=Upside) on CellC4driving Revenue Growth (8% / 14% / 20%), Gross Margin (68% / 72% / 75%), and OpEx Ratio via cleanCHOOSEswitches. - Operating Income & NOPAT: Compute
EBITDA = Gross Profit - Cash OpEx, deductD&A(4.0%of revenue), apply corporate tax (23%) toEBITcleanly for Unlevered NOPAT (EBIT * (1 - TaxRate)). - Unlevered Free Cash Flow (
UFCF): Add backD&A, subtractCapEx(4.5%of revenue), subtract positiveChange in Net Working Capital(ΔAR + ΔInv - ΔAP), verifying every sign matches cash-in vs cash-out cleanly! - Discounted Cash Flow (
XNPVvs Manual Discount Factors): Discount 5 years of UFCF via explicit(1 + WACC)^(-t)factors using Mid-Year Convention (t - 0.5), add Discounted Terminal Value (Exit_EBITDA * TerminalMultipleor Gordon Growth), subtract Net Debt to report Implied Equity Value.
21. Institutional Finance Formula & Shortcut Field Reference
Goal: Keep essential modeling formulas, sign conventions, and rapid audit shortcuts ready on a one-page cheat card during financial model builds.
| Financial Concept | Clean Excel Modeling Expression | Audit / Pitfall Reminder |
|---|---|---|
| Net Present Value (Mid-Year) | =SUMPRODUCT(UFCF_Range, 1/(1+WACC)^(Period_Nums-0.5)) |
Avoid Excel NPV() quirk starting at t=1 vs uneven Cash Flows |
| Terminal Value (Gordon Growth) | =(Final_UFCF * (1 + g)) / (WACC - g) |
Verify long-term g (2.0%–3.0%) strictly below nominal GDP & WACC! |
| Revolver Auto-Borrow / Repay | =MIN(0, CashAvailable + BegCash - MinCash)*(-1) |
Always guard with MAX(-BegRevolver, ...) so debt never goes negative |
| Leverage Covenant Ratio | =IF(EBITDA<=0, "N/A", (TotalDebt - Cash) / EBITDA) |
Negative EBITDA flips signed ratios misleadingly unless guarded cleanly |
| Horizontal Fill Audit | Select row -> press Ctrl + R + inspect with Ctrl + \ |
Ctrl + \ highlights row formula inconsistencies horizontally in one click! |
By enforcing strict blue/black/green formatting, circuit-broken debt sweeps, balanced three-statement checks (Variance = 0.00), and two-way sensitivity checks, your financial models remain bulletproof through lender diligence and boardroom scrutiny alike.
That's the whole book. Keep the PDF for offline reading.
Downloading requires a free Google sign-in -- reading online never does.