
Standard Excel PivotTables work wonderfully when all your reporting columns already sit inside a single rectangular table under roughly half a million rows. The moment your company tracks sales across three years of daily invoices (FactSales), pulls SKU unit costs from a Product Catalog (DimProduct), maps branch budgets from a Store directory (DimStore), and compares year-over-year quarters across channels, the single-flat-sheet model groans under VLOOKUP columns, bloated .xlsx file sizes, and sluggish saves.
Power Pivot and its analytical formula language DAX (Data Analysis Expressions) exist directly inside desktop Excel (Data → Manage Data Model) to erase those walls cleanly. Instead of flattening five tables together with fragile lookup formulas, Power Pivot stores compressed columnar tables in RAM, links them via crisp one-to-many relationships, and evaluates millions of rows in milliseconds. Across twelve worked chapters — backed by live Excel schema tables, measure matrices, time-intelligence schedules, and Pivot views — you will build reliable DAX models from scratch.
1. Why the Data Model Beats Flat-Sheet VLOOKUP Sprawl
Goal: Understand Power Pivot’s VertiPaq columnar compression and when moving to the Data Model saves gigabytes of workbook bloat.
Every worksheet VLOOKUP or XLOOKUP copying "Category", "Brand", and "UnitCost" down 250,000 sales lines stores 750,000 duplicated text cells inside Excel’s workbook XML grid. File sizes explode, recalculation pauses on every filter change, and adding a second fact table (FactBudget alongside FactSales) becomes almost impossible inside one PivotTable.
Power Pivot reverses that design completely:
- Columnar Dictionary Compression: Repeating values like
"Enterprise Analytics"are stored once in a dictionary and referenced by compact integers, shrinking multi-million-row datasets by 5×–15× inside the saved.xlsx. - Multi-Table PivotTables: Drag
DimProduct[Category]andDimDate[Quarter]alongside metrics computed from bothFactSalesandFactBudgetinside one unified PivotTable without merging tables! - Centralized Measure Logic: Write
[Gross Margin %]once in Power Pivot, and every PivotTable, PivotChart, and Slicer across twenty dashboard sheets inherits identical business math automatically.
2. Star Schema Architecture: Facts vs. Dimensions
Goal: Organize tables into a clean Star Schema (Fact center surrounded by Dim tables) so filter propagation never creates ambiguous results.
Every durable Power Pivot model shares one proven blueprint called a Star Schema: narrow numeric transaction tables (Facts) at the center connected via single-column keys to rich descriptive lookup tables (Dimensions) around the perimeter.

Non-Negotiable Rules for Clean Dimensions & Facts
| Property | Dimension Tables (DimDate, DimProduct, DimStore) |
Fact Tables (FactSales, FactBudget) |
|---|---|---|
| Role | Who, What, Where, When (slicers, rows, columns) | Numbers & Events (Revenue, Units, Costs) |
| Key Uniqueness | Strict one row per ID (ProductKey unique) |
Repeats keys thousands/millions of times |
| Relationship Side | Always the 1 (One) side |
Always the * (Many) side |
| Arrow Direction | Flows downward from Dim → Fact |
Never filters upward into Dim by default |
Keep Power Query (see Power Query & M Transformations (Volume 2)) strictly in charge of cleaning duplicates out of Dimension keys and stripping redundant text notes out of Fact rows before clicking Close & Load To… → Only Create Connection + Add this data to the Data Model.
3. Explicit Measures vs. Implicit Drag-and-Drop Columns
Goal: Abandon implicit "Sum of Revenue" drags in favor of explicit DAX measures that are reusable, format-locked, and safe in nested math.
Dragging raw numeric columns straight into the Values box produces implicit measures — hidden one-off aggregations that you cannot reference inside other formulas, cannot share cleanly across PivotTables, and cannot easily wrap in ratio guards. Writing explicit DAX Measures inside the Power Pivot calculation area (Measures block) cures all three flaws immediately.
Your First Three Foundational Measures
Total Sales := SUM( FactSales[Revenue] )

Total Units := SUM( FactSales[Units] )

Average Selling Price := DIVIDE( [Total Sales], [Total Units] )
Notice two critical best practices built right into those lines:
- Unqualified measure names (
[Total Sales]): Always refer to measures without a table prefix, while ALWAYS qualifying column names (FactSales[Revenue]). At a single glance anyone reading[Total Sales] / SUM(FactSales[Units])knows instantly which term is a dynamic measure and which is a physical column! - Always prefer
DIVIDE(num, den, alt)over/: When a Pivot cell filters down to zero matching orders,/throws ugly#DIV/0!errors across reports, whereasDIVIDEcleanly returnsBLANK()(or0) and runs faster inside DAX’s engine.
4. Row Context vs. Filter Context: The Core Mental Model
Goal: Master the two distinct ways DAX evaluates formulas so SUM vs. SUMX and unexpected subtotal bugs never puzzle you again.
Nine out of ten confusing DAX numbers come from mixing up Row Context and Filter Context:
- Row Context means “evaluate column by column for a single current row.” Calculated Columns inside a table and Iterator functions (
SUMX,AVERAGEX,RANKX) run inside Row Context. There is NO aggregation across rows here —FactSales[Units] * FactSales[UnitPrice]multiplies strictly the two cells on that single line. - Filter Context means “evaluate over whatever subset of rows remains visible after Slicers, Row Labels, Column Labels, and Report Filters intersect.” Measures like
SUM(FactSales[Revenue])run strictly inside Filter Context; there is no “current single row.”
Seeing Both Contexts Collide Inside One Cell
Consider a PivotTable placing Region on Rows (North, South, West) and Channel on Columns (Direct, Partner). At the intersection cell (North, Partner), Filter Context actively restricts DimStore[Region] = "North" AND DimChannel[Channel] = "Partner", letting those filters cascade cleanly down relationship arrows into FactSales, before SUM(FactSales[Revenue]) sums only the surviving matching transactions!
5. Iterators (SUMX, AVERAGEX) & Cross-Table Lookups (RELATED)
Goal: Compute accurate weighted line-item totals and true gross margins across linked tables without adding physical calculated columns to FactSales.
Suppose FactSales stores Qty and Revenue, while DimProduct stores UnitCost (keeping unit costs centralized in the catalog instead of bloating millions of sales rows). You might instinctively try writing SUM(FactSales[Qty]) * SUM(DimProduct[UnitCost]) — which multiplies total quantity by the sum of all catalog prices, creating a wildly wrong answer!
Instead, pair an iterator (SUMX) with RELATED so DAX walks line-by-line across matching FactSales rows, fetches each SKU’s cost from the 1-side DimProduct table, computes exact line cost, and sums the exact result cleanly in memory:

Total Cost :=
SUMX(
    FactSales,
    FactSales[Units] * RELATED( DimProduct[UnitCost] )
)

Gross Profit := [Total Sales] - [Total Cost]

Gross Margin % := DIVIDE( [Gross Profit], [Total Sales] )
Because Gross Margin % wraps [Gross Profit] and [Total Sales] (rather than averaging line-by-line percentages), every Grand Total and Regional subtotal in your PivotTable stays mathematically weighted-accurate.
6. Unleashing CALCULATE: Modifying Filter Context at Will
Goal: Write measures that isolate specific channels, override user slicers cleanly, and compute dynamic % of Total shares inside any Pivot slice.
If SUM and DIVIDE are DAX’s bricks, CALCULATE is the entire structural frame. CALCULATE( expression, filter1, filter2, ... ) evaluates any expression inside a modified Filter Context — adding new filters, replacing existing filters, or clearing filters with ALL / REMOVEFILTERS.
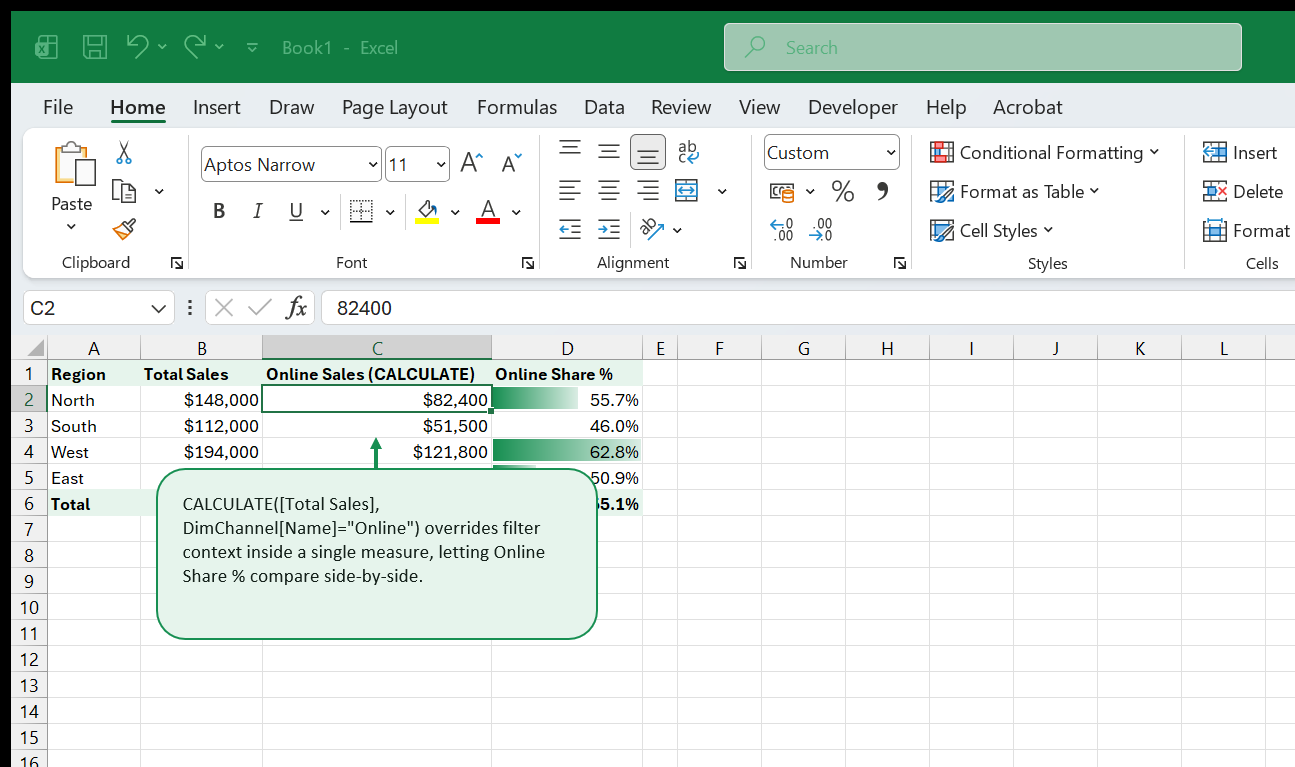
Pattern 1: Channel-Scoped Measures
Online Sales :=
CALCULATE(
    [Total Sales],
    DimChannel[Channel] = "Online"
)

Online Share % := DIVIDE( [Online Sales], [Total Sales] )
Notice how cleanly Online Sales interacts with Region: inside North warehouse, Region = "North" remains active while CALCULATE injects Channel = "Online", yielding $82,400 out of $148,000 (55.7%).
Pattern 2: Clearing Context for % of All Regions (ALL / ALLSELECTED)
All Region Sales :=
CALCULATE(
    [Total Sales],
    ALL( DimStore[Region] )
)

Region Mix % := DIVIDE( [Total Sales], [All Region Sales] )
Swap ALL for ALLSELECTED when you want denominator totals to ignore individual Row labels while still respecting an external Year or Category Slicer selected on the page!
7. Time Intelligence: YTD, Prior Year & YoY Growth (DimDate)
Goal: Unlock effortless Year-to-Date, Quarter-to-Date, and Prior-Year variance metrics backed by a marked continuous Date Table.
Before writing a single time-intelligence measure, satisfy Power Pivot’s one strict prerequisite: link FactSales[DateKey] to a continuous unbroken DimDate calendar covering complete Jan 1–Dec 31 years, and click Design → Mark as Date Table selecting DimDate[Date]. Once marked, DAX time intelligence calculates running balances and prior-period offsets cleanly:

YTD Sales :=
TOTALYTD( [Total Sales], DimDate[Date] )

Prior Year Sales :=
CALCULATE(
    [Total Sales],
    SAMEPERIODLASTYEAR( DimDate[Date] )
)

YoY Variance $ := [Total Sales] - [Prior Year Sales]

YoY Growth % := DIVIDE( [YoY Variance $], [Prior Year Sales] )
Even if a user slices strictly to Q1 or picks May alone on a Pivot Slicer, YTD Sales accumulates cleanly from January 1 up through the active end date, and YoY Growth % automatically compares like-for-like days from the previous year.
8. Clean KPI Thresholds, Margin Bands & Executive Alerts
Goal: Turn raw DAX ratios into clear performance tiers (Exceeds, On Target, Watch) backed by safe SWITCH branching and Data Bars.
Numbers rarely spur action until paired against targets. Instead of hard-coding threshold flags across ten sheets, define target status measures inside DAX using VAR (local measure variables for speed and readability) and SWITCH(TRUE(), ...):

Margin Status :=
VAR Margin = [Gross Margin %]
RETURN
SWITCH(
    TRUE(),
    ISBLANK( Margin ), BLANK(),
    Margin >= 0.55, "Exceeds",
    Margin >= 0.40, "On Target",
    "Watch"
)
Notice ISBLANK( Margin ): guarding blanks prevents empty combinations from accidentally showing "Watch" when zero transactions occurred!
9. Variables (VAR / RETURN) for Speed & Debugging Sanity
Goal: Eliminate repeated sub-calculations and inspect complex nested DAX step-by-step using VAR.
Computing [Gross Margin %] inside both numerator checks and display branches used to force DAX to evaluate the same expression multiple times. Using VAR ... RETURN caches each intermediate step cleanly inside memory once, cutting query runtime dramatically on large workbooks and making every formula read like clean top-to-bottom Python or SQL:
Net Growth Alert :=
VAR CurrentRev = [Total Sales]
VAR PriorRev = [Prior Year Sales]
VAR Delta = CurrentRev - PriorRev
RETURN
IF( NOT ISBLANK( PriorRev ), DIVIDE( Delta, PriorRev ) )
Better still, debugging becomes trivial: swap the final RETURN line temporarily to RETURN PriorRev to verify exactly what variable computed inside any Pivot cell!
10. Multi-Fact Modeling (FactSales vs. FactBudget)
Goal: Connect Budget and Actual Fact tables safely through shared DimDate and DimProduct dimensions without broken many-to-many joins.
Never directly link FactSales to FactBudget! Sales sit at daily SKU-order granularity while budgets sit at monthly Category granularity. Instead, connect both Fact tables cleanly downward from shared DimDate and DimProduct Dimensions:
- Write
[Total Sales] := SUM(FactSales[Revenue]) - Write
[Budget Sales] := SUM(FactBudget[BudgetAmt]) - Write
[Budget Variance $] := [Total Sales] - [Budget Sales]
Now drag DimProduct[Category] and DimDate[MonthName] into ONE PivotTable alongside all three measures. Because filters flow downward from shared Dimensions cleanly into both Fact tables independently, Actuals vs. Budget compares seamlessly with zero cross-table cardinality errors!
11. Multi-Measure Executive Pivot Layouts & Slicer Polish
Goal: Assemble crisp multi-measure Power Pivot outputs ready for board packets, slicers, and CUBE formula extraction.

Converting Pivot Cells to Flexible CUBE Formulas (Power Pivot Secret)
Once an executive loves a PivotTable layout but asks for custom spacer rows or asymmetrical quarter + YTD headers next to each other, select inside the Power Pivot PivotTable and click PivotTable Analyze → OLAP Tools → Convert to Formulas. Excel dissolves the rigid Pivot grid into crisp native CUBEVALUE and CUBEMEMBER worksheet cells still live-wired to your Data Model Slicers!
12. Model Hygiene, Performance Checklist & Next Guides
Goal: Keep .xlsx Data Model files fast, trim high-cardinality timestamp noise, and expand your analytics toolkit across ExcelBack.
Apply this quick five-point model audit before shipping any Power Pivot workbook:
- Drop unused high-cardinality IDs: Remove raw
TransactionTimestampmilliseconds or free-textCommentsfromFactSalesinside Power Query before loading (Choose Columns). Splits date + time only if needed — timestamps kill dictionary compression! - Hide Foreign Keys in Client Tools: Right-click
FactSales[ProductKey]andFactSales[DateKey]inside Power Pivot Diagram View → Hide from Client Tools. Users only ever slice by clean names insideDimProductandDimDate. - Never connect
FacttoFact: Always route through conformedDimtables (1 → *). - Sort
MonthNamechronologically: ClickDimDate[MonthName]→ Sort by Column →MonthNumber, ending"April, August, December..."alphabetical ordering forever. - Pair with Visual Reporting & Modeling Guides: Keep learning across Pivot Tables & Data Models (Volume 2), Power Query & M Transformations (Volume 2), and Financial Modeling in Practice.
13. Iterator Functions (SUMX, AVERAGEX, RANKX) Decoded
Goal: Know exactly when row-by-row DAX iterators (SUMX, AVERAGEX, RANKX) replace calculated columns—saving megabytes of RAM without sacrificing accuracy.
Beginners often ask: “If SUM(FactSales[Revenue]) works fast, why do DAX tutorials insist on SUMX?”
Regular aggregators (SUM, AVERAGE, MIN, MAX) operate on one physical column at a time. They cannot multiply [Units] * [NetUnitPrice] across millions of rows unless you first materialize an expensive stored Calculated Column (Revenue) on disk!
Iterators (-X suffix functions) solve that cleanly in memory:
- Evaluate the
<table>argument under the active Pivot filter context. - Step row-by-row evaluating the
<expression>in Row Context (Units * UnitPrice * (1 - Discount)). - Aggregate those temporary row results using
SUM,AVERAGE, orRANK, leaving zero uncompressed RAM bloat behind:
Net Revenue = SUMX(FactSales, FactSales[Units] * RELATED(DimProduct[UnitPrice]) * (1 - FactSales[DiscountPct]))Similarly, RANKX(ALL(DimProduct[ProductName]), [Total Revenue]) ranks products dynamically inside Pivot subtotals—automatically breaking ties (Dense vs Skip) and recalculating cleanly whenever a user slices by Country or Year!
14. Evaluation Contexts: Row Context vs Filter Context Deep Dive
Goal: Master context transition (CALCULATE)—the #1 mental breakthrough separating frustrated copy-paste DAX users from fluent BI modelers.
Every single DAX bug traces back to mixing up two distinct evaluation engines:
- Filter Context: The set of active filters coming from PivotTable Rows, Columns, Slicers, Report Filters, AND outer
CALCULATE()filter arguments (DimDate[Year] = 2026,DimStore[Region] = "West"). Measures ALWAYS start inside Filter Context. - Row Context: Active pointer onto one current table row (existing inside Calculated Columns and inside iterator loops like
SUMXorFILTER). Notice Row Context by itself does NOT filter related tables (SUM(FactSales[Units])inside aDimProductcalculated column sums EVERY product until wrapped inCALCULATE!).
Context Transition Inside CALCULATE
Whenever you call [MyMeasure] inside an iterator (SUMX), DAX invisibly wraps [MyMeasure] in CALCULATE(...)—converting the current row values into an equivalent Filter Context (context transition)! That is why [Total Revenue] works inside RANKX(ALL(DimProduct[ProductName]), [Total Revenue]) while SUM(FactSales[Revenue]) directly without [...] measure syntax repeats the grand total identically on every row!
15. ALL, ALLEXCEPT & ALLSELECTED for Dynamic Percentage Shares
Goal: Write bulletproof "% of Regional Total" and "% of Visible Slicer Total" measures that behave intelligently even when stakeholders click Slicers.
Notice the huge UX difference between three classic denominator removers:
| Function | Filter Behavior Inside Denominator | Business Use Case |
|---|---|---|
ALL(DimProduct) |
Clears ALL product filters regardless of Slicer picks | Fixed share of All Company Products (never shifts with Product slicer) |
ALLSELECTED(DimProduct) |
Respects Slicer / outer Report Filters, clears ONLY inner Pivot rows | Dynamic “% of Filtered Selection” so top-3 filtered items sum to 100.0%! |
ALLEXCEPT(DimProduct, DimProduct[Category]) |
Clears SKU filter, keeps parent Category filter intact |
Exact “% of Parent Category” ratio inside multi-tier Pivots |
Visible Share % = DIVIDE([Total Sales], CALCULATE([Total Sales], ALLSELECTED(DimProduct)), 0)Choose ALLSELECTED() on executive slicer boards whenever stakeholders expect visible percentages to foot cleanly to 100.0% after clicking filters.
16. Advanced Time Intelligence: Moving Averages, SamePeriodLastYear & Custom Calendars
Goal: Build smooth 90-day rolling revenue trends and QTD / Prior Quarter variances cleanly inside a single PivotTable.
Once your DimDate table sits marked cleanly as a Date Table (Table -> Design -> Mark as Date Table on [Date] with unbroken daily rows!), DAX unlocks surgical temporal shifts:
- Previous Month (
PM Sales):CALCULATE([Total Sales], DATEADD(DimDate[Date], -1, MONTH))(NoticeDATEADDhandles leap-year Feb29and30/31-day shifts seamlessly better thanPREVIOUSMONTHwhen partial periods occur!). - Rolling 3-Month Revenue:
Rolling 3M Sales = CALCULATE([Total Sales], DATESINPERIOD(DimDate[Date], MAX(DimDate[Date]), -3, MONTH))- Rolling 3-Month Monthly Average: Divide
[Rolling 3M Sales]dynamically byCALCULATE(DISTINCTCOUNT(DimDate[YearMonth]), DATESINPERIOD(...))so seasonal noise flattens cleanly onto trend charts without blank leading months.
17. Semi-Additive Measures: Inventory, Headcount & Closing Balances
Goal: Prevent Power Pivot from accidentally adding January’s $250K cash balance to February’s $260K cash balance to report $510K in Q1!
Revenue and Units are fully additive across time (Jan + Feb + Mar = Q1). Headcount, Warehouse On-Hand Inventory, and Bank Account Balances are semi-additive: you sum across Stores or SKUs cleanly, never across Dates!
Use LASTNONBLANK / LASTDATE inside CALCULATE so PivotTables automatically display the closing snapshot balance for any month, quarter, or year selected:
Closing Stock = CALCULATE(SUM(FactInventory[OnHandUnits]), LASTDATE(FactInventory[SnapshotDate]))When viewing Q1 (Jan–Mar), Closing Stock returns Mar 31 units across every warehouse (West + Central + East) automatically instead of triple-counting shelf counts!
18. Disconnected Parameter Tables for What-If Slicers
Goal: Build live Scenario Multipliers (Discount Sensitivity: -10%, -5%, 0%, +5%, +10%) controlled cleanly by a Pivot Slicer with zero edits to source data.
Upload a tiny 5-row helper table named ScenarioGrowth (Label, Multiplier: "-10%" / 0.90, …, "+10%" / 1.10) into the Data Model with zero relationships to FactSales!
Capture the user’s Slicer click via SELECTEDVALUE (or HASONEVALUE + fallback):
Projected Revenue = [Total Sales] * SELECTEDVALUE(ScenarioGrowth[Multiplier], 1.0)Clicking "+10%" inside the dashboard Slicer multiplies every store, category, and YTD measure instantaneously across your entire report—without copying a single workbook tab!
19. DAX Studio Concepts, VertiPaq Compression & Pre-Publish Checklist
Goal: Keep multi-million-row Power Pivot models nimble, readable, and completely bug-free before sharing with finance directors.
VertiPaq (Power Pivot’s columnar in-memory engine) achieves 10x–30x compression when column cardinality stays tight:
- Drop unused high-cardinality columns early: Never pull timestamp milliseconds (
OrderTimestampdown to seconds), raw free-text notes, or GUID strings intoFactSales—split Date and Time cleanly if needed or drop descriptive text into Power Query archive queries. - Use Integers for Surrogate Keys & Money Columns (
Currencytype): Fixed decimal (Currency) compresses dramatically tighter than arbitrary floating point numbers. - Hide Foreign Keys on Fact Tables (
Hide from Client Tools): HideFactSales[DateKey],FactSales[ProductKey], andFactSales[StoreKey]cleanly inside Diagram View so Pivot users always slice using Dimension attributes (DimProduct[Category],DimDate[Year]) rather than broken fact keys! - Enforce Measure Table Organization: House every explicit measure neatly on a dedicated
_Measuresdisplay table sorted alphabetically (01_Core,02_TimeIntel,03_KPIs) and format percentages (0.0%) and currency (\$#,##0) centrally right inside the Measure properties dialog once so every future Pivot inherits clean formatting automatically.
20. Hands-On Practice Lab: Retail Executive Star Schema & YoY Model
Goal: Assemble a complete Power Pivot Data Model from scratch—linking one FactSales transaction table to three Dimension lookup tables and publishing four dynamic KPI measures onto a Pivot Slicer screen.
Work through this end-to-end build cleanly inside Power Pivot -> Manage:
- Import & Star-Link (
Diagram View): PullFactSales,DimDate,DimProduct, andDimStoreinto the Data Model via Power Query -> Only Create Connection -> Add this data to the Data Model. DragDimDate[Date] -> FactSales[OrderDate],DimProduct[ProductKey] -> FactSales[ProductKey], andDimStore[StoreKey] -> FactSales[StoreKey]cleanly—confirm1sits strictly on Dimension tables and*onFactSales. - Mark Date Table & Hide Keys: Select
DimDate-> Design -> Mark as Date Table ->[Date]. Right-click foreign keys insideFactSales(ProductKey,StoreKey,DateKey) -> Hide from Client Tools. - Author Core & Time-Intel Measures (
_MeasuresTable):Total Revenue := SUMX(FactSales, FactSales[Units] * RELATED(DimProduct[UnitPrice]))PY Revenue := CALCULATE([Total Revenue], SAMEPERIODLASTYEAR(DimDate[Date]))YoY Growth % := DIVIDE([Total Revenue] - [PY Revenue], [PY Revenue], 0)
- Build Slicer Dashboard: Insert PivotTable -> Use this workbook’s Data Model, place
DimStore[Region]in Rows, formatYoY Growth %with green/red arrows, and attachDimDate[Year]andDimProduct[Category]Slicers cleanly.
21. Power Pivot DAX Pattern & Debugging Quick Reference
Goal: Troubleshoot measure discrepancies immediately and copy-adapt production-tested DAX blueprints cleanly across any BI workbook.
| BI Requirement | Clean Production DAX Measure | Evaluation Context Key Point |
|---|---|---|
| Dynamic Margin Ratio | Margin % := DIVIDE([Total Margin], [Total Revenue], 0) |
Always aggregate sums first inside ratio; avoid AVERAGE(MarginPct) |
| Year-to-Date Accumulation | YTD Sales := TOTALYTD([Total Revenue], DimDate[Date]) |
Requires unbroken DimDate calendar marked cleanly as Date Table |
| Fixed Category Share % | Cat Share % := DIVIDE([Total Revenue], CALCULATE([Total Revenue], ALLSELECTED(DimProduct)), 0) |
ALLSELECTED honors external Slicers while clearing Pivot Row filter |
| Unfiltered Baseline Benchmark | Company Sales := CALCULATE([Total Revenue], REMOVEFILTERS(DimStore)) |
Modern readable synonym (REMOVEFILTERS) replacing ALL() cleanly |
| First-Time Dynamic Rank | Product Rank := IF(HASONEVALUE(DimProduct[Name]), RANKX(ALLSELECTED(DimProduct[Name]), [Total Revenue], , DESC, Dense)) |
HASONEVALUE prevents nonsensical Grand Total rank #1 on bottom line! |
22. Common DAX Pitfalls Solved (Why Measures Return Wrong Totals)
Goal: Diagnose the three mysterious DAX behaviors that confuse Excel formula veterans during their first month using Power Pivot.
- “Grand Total Does Not Equal Sum of Visible Rows!” Remember: DAX evaluates the Grand Total cell independently in its own cleared Filter Context—it does not visually sum rendered UI rows above it! Whenever a row-level
IF([Sales] > 1000, [Margin])fails at Grand Total level, iterate row-by-row cleanly across the Dimension usingSUMX(VALUES(DimProduct[SKU]), IF(...))so Total equals the exact visible sum! - “Why Did My Filtered Measure Return Blank Instead of Zero?” Writing
DIVIDEorCALCULATEover months with zero transactions yields(blank)in DAX rather than0. Adding+ 0cleanly onto UI display measures (CALCULATE([Total Revenue], ...) + 0) forces visible0ONLY where desired—though leave dense sparse SKU grids without+ 0to keep PivotTables fast! - “Active vs Inactive Date Relationships (OrderDate vs ShipDate)!” Never draw two solid lines from
DimDateontoFactSales! Link[OrderDate]as the active solid relationship and[ShipDate]as a dashed inactive relationship, then activate Ship Date selectively inside one measure usingUSERELATIONSHIP(FactSales[ShipDate], DimDate[Date]).
That's the whole book. Keep the PDF for offline reading.
Downloading requires a free Google sign-in -- reading online never does.